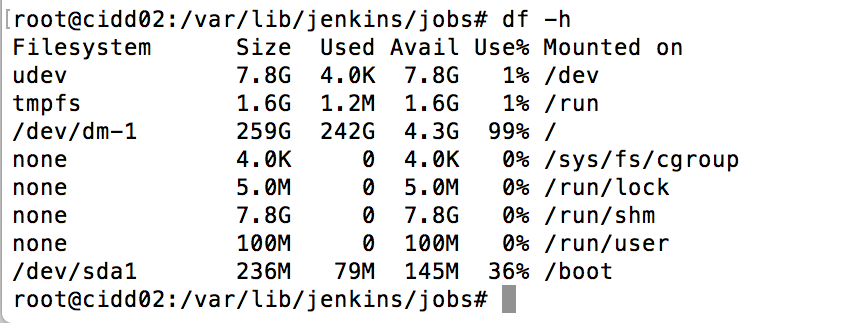
We recently faced an error where jenkins in our Android CI setup was aborting builds because of insufficient space on the box. This was strange since we have allocated a huge 250G box solely for this purpose.
While trying to solve this issue, I came across some useful things that I think might be useful for other people and whoever is facing this issue, it’d be worthwhile to check these points:
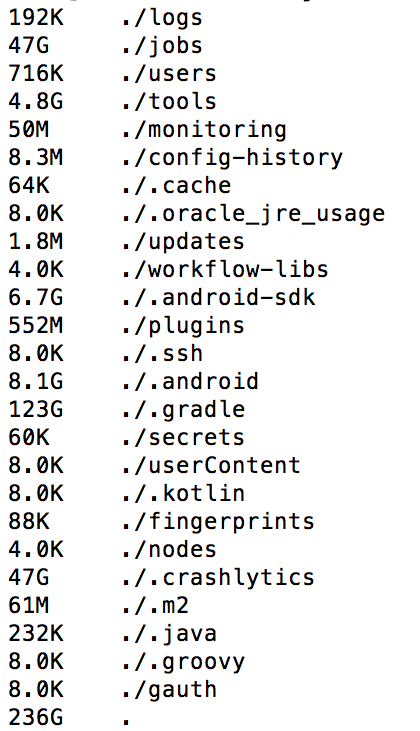
- If you have been using gradle’s build cache, check it’s folder’s size ( .gradle folder in your home). In my case, it was taking 123GB !. This is because it never used to clear the cache.
Keep in mind that clearing all of it will slow down your builds. So you’ll have to clean it smartly. One option is going with time based approach. This tip (shared by Gautam Korlam) cleans up files not accessed within the last month:
find ~/.gradle -type f -atime +30 -delete
find ~/.gradle -type d -mindepth 1 -empty -delete
In my case, I readjusted it to be 7 days, instead of 30.
Also, gradle auto-clears this in newer versions (starting from 4.10.1). So updating your gradle would ensure that you won’t have to do it manually again.
-
If you use crashlytics, check .crashlytics folder in your home directory. In my case, it was taking 40GB. I still don’t know why it was taking too much time but you can safely delete this directory as stated here.
I haven’t gotten any update from those guys so for now, I think I’ll have to clean it manually. At the time of writing this, it’s again occupying 2.5G.
-
Check the workspace folders in each of your job’s home directory. If you have not been performing clean before/after each build, these directories would be huge.
Delete your build directories and add this step in your jenkins job. This can be added in the Source Code Management section of the job settings.
-
Also, jenkins provides a ‘Discard old build’ option in job settings where you can configure things like : no of days to keep builds, max no of builds to keep, no of days to keep artifacts etc. Do use them.
Some screenshots of this excercise :
- See the ‘/’ partition occupying 99% :

2. Distribution of that ~250G memory :

3. One of our job's folder occupying 13G. You can see that workspace folders are the culprit here.

4. Final state after performing all the steps mentioned above. 198G of free memory :D

Comments
Post a Comment